
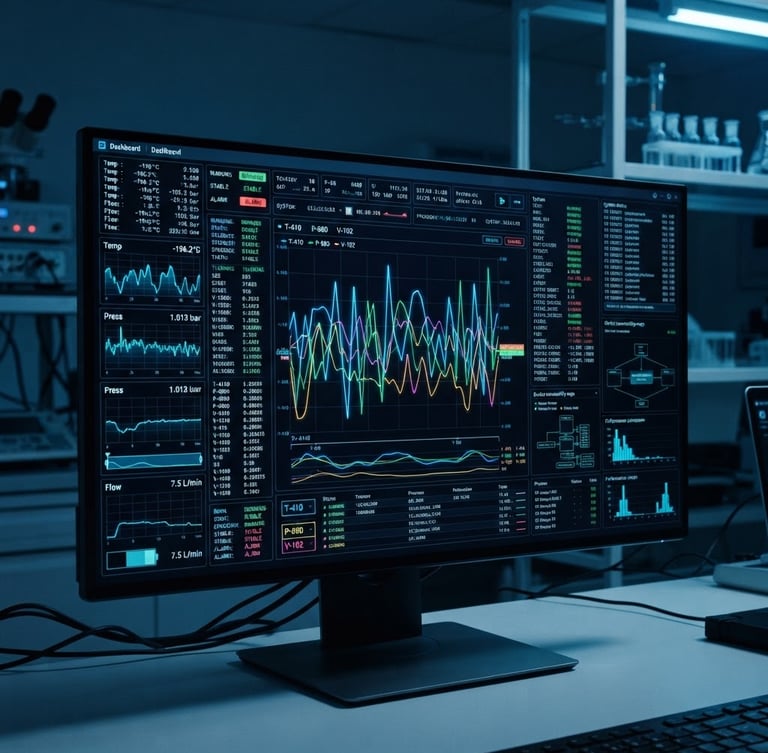
Zero-latency telemetry dashboard
Integrate live hardware-level equipment telemetry directly into active protocol tracking. Eliminate manual logging errors and automate GLP compliance in real time.
Engineered for precision
Replace fragmented spreadsheets with high-fidelity pipelines built specifically for modern clinical and biotech environments.
Protocol workflows
Equipment uptime
Data pipelines
Track active protocol steps alongside live instrument readouts. Automated logs capture sensor fluctuations instantly.
Centralize calibration schedules and track live telemetry. Receive instant alerts before critical instruments fall out of spec.
Export structured, audit-ready telemetry logs directly to your analysis tools. Eliminate manual transcription and human error.
Clinical-grade infrastructure
RunLab operates at the hardware layer to deliver absolute data integrity. Review our core operational parameters.
Latency
Compliance
Integration
Sub-100ms telemetry polling directly from hardware controllers to active browser sessions.
Fully automated cryptographic audit trails designed to meet strict FDA 21 CFR Part 11 guidelines.
Native REST API endpoints and webhooks for direct pipeline exports into Python, R, and LIMS databases.
Ready to centralize operations?
Schedule a live telemetry demonstration with our engineering team to see RunLab active on your hardware.
RunLab
Zero-latency telemetry and protocol tracking for GLP compliance.
Home-Platform-Compliance-Request Demo
Telemetry
ops@runlab.site
Zero-latency data pipelines
GLP Compliant Operations
© 2026 RunLab-Built to be as robust as your science.
PROTOCOL-LEVEL TRACKING